-
AnalyzeParticles(m, gray_level, min_area)
-
Returns information about the particles found in the image provided as a matrix m. The particles are detected by thresholding at the gray level gray_level. Particles with an area smaller than min_area are not considered.
m: a matrix
gray_level: the threshold gray level, an integer in [0 ... 255]
min_area: the minimum area in pixels, a real number
The information returned by AnalyzeParticles is a list of records, one per particle. Each record contains the following key-value pairs:
- centre
-
the position of the center of the particle, as a list of two real numbers
- area
-
the area of the particle in pixels
- perimeter
-
the perimeter of the particle in pixels
- major axis and minor axis
-
the lengths of the major and minor axes of the particle in pixels
- angle
-
the angle of the major axis of the particle with respect to the horizontal, in radian
|
-
ListParticles(m, gray_level, min_area, column_sorted)
-
Same as AnalyzeParticles, but returns the results as a string (rather than an AppleScript list). The string is a tabulated array with 6 columns: x, y (position of the center of the particle), area, minor and major axes and perimeter. The table is sorted according to the column index specified by column_sorted.
column_sorted: the index of the sorting column, an integer in [1 ... 6]
-
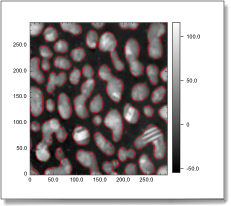
ShowParticles(m, gray_level, planar_view_ref)
-
Like AnalyzeParticles, but no information is returned about the particles: ShowParticles displays the particles in a new graphic window, as red contour lines over the grayscale image. ShowParticles returns a reference to the new planar view.
planar_view_ref: you can pass the reference returned by ShowParticles, in order to have ShowParticles refresh the graphic rather than create a new one
|
|