Introduction
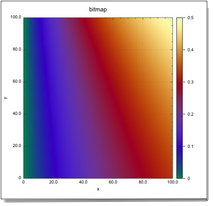
A bitmap displays a raster image of a 2D array of real numbers, in other terms a scalar field that is defined on a periodic 2D lattice. You do not choose the scales: the x axis is the column index and the y axis is the row index. Unlike for the other kinds of plots, the origin is in upper left corner: the first row of data plots at the top.
Providing the bitmap with data
-
data
- Provide a matrix as the bitmap's data property. The bitmap will map the values into the color palette.
-
color palette
- The color palette may be, either the name of a palette or a list of 4n numbers in the range [0..1], as explained in the chapter about color palettes.
-
limits
- By default the limits property is set to {"auto","auto"}: the bitmap maps the whole range of values into the color palette. To restrict the mapping to some interval of values of data set the limits property to some {zmin, zmax} range.
|
|
Graphic options for the bitmap
-
inverted
- You can invert the mapping by reversing the palette with the boolean inverted property.
-
draw palette
- You can hide or show the bitmap's color scale with the boolean draw palette property.
-
legend frame
- If shown, you can choose the color scale's location by providing its boundaries as the legend frame property, under the form {x0, y0, dx, dy}. {x0, y0} is the origin of the boundaries respective to the container planar view's coordinates system and {dx, dy} are the sizes. The color progression is horizontal or vertical, according to the aspect ratio of {dx, dy}.
|