
QuickContourMap
|
|
Previous | Next | |
|
|
||
|
QuickContourMap
|
||
| Home ▸ Documentation ▸ SmileLab ▸ Scripting ▸ Making graphs by script ▸ QuickPlotLib ▸ QuickContourMap | ||
|
|
||
QuickContourMap(x, y, z, levels, anObject) displays contour lines for a scalar field. The rules for the data x, y and z are the same as for QuickScalarMap. You provide the levels for the contours in the levels property: either as a list of values, or as one integer - to specify a number of automatic levels.set f to "x^2+0.01*y^4+0.05*(x+y)^3" |
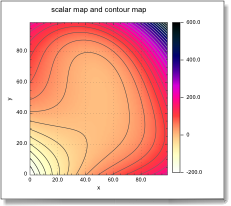 A contour map over the color map of a function |
|
|
||
| Copyright ©2008 Paris, Satimage | ||