
QuickFFTSurface
|
|
Previous | |
|
|
||
|
QuickFFTSurface
|
||
| Home ▸ Documentation ▸ SmileLab ▸ Scripting ▸ Making graphs by script ▸ QuickPlotLib ▸ QuickFFTSurface | ||
|
|
||
QuickFFTSurface(m, anObject) displays the modulus of the Fourier transform of a 2-d array of real numbers as the z coordinate of a surface z(x,y). The phase of the Fourier transform is mapped into the color palette of the surface. The 2-d array m has to be a matrix.set f to "sin(64*x*y)+sin(x*y*x*y)" |
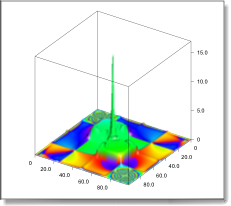 The colors on the surface figure the phase of the Fourier transform |
|
|
||
| Copyright ©2008 Paris, Satimage | ||