Import script
-- create random data
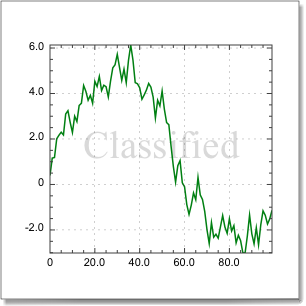
set xs to createarray 100
set ys to randomarray 100 range {-1, 1}
set ys to runningsum ys
-- plot data
set c to QuickCurve(xs, ys, "Random walk")
set c's pen color to 4
set c's pen width to 2
-- get reference to plot view
set the_plot_view to c's container
-- by default its background color is opaque white:
set the_plot_view's fill color to {0, 0, 0, 0}
-- prepare data for drawing
-- compute middle of plot
set {i0, j0, di, dj} to plot frame of the_plot_view
set ct to {i0 + di / 2, j0 + dj / 2}
-- launch drawing
BeginFigure(the_plot_view)
TextMoveTo(ct)
SetFillColor({0, 0, 0, 0.15})
SetTextSize(di / 5)
SetTextFont("Times New Roman")
DrawString("[h]Classified")
EndFigure()
|