- pbc1, pbc2
- If the set of the (x,y) points where the field is defined is a 2-dimensional parametric family (x(u,v),y(u,v)) (e.g. if the field is given in polar coordinates), provide matrices with the same sizes as the data property as the xdata and ydata properties. You can instruct the scalar map to "close" the drawing according to periodic boundary conditions on one or both indices of the matrices: setting pbc1 (or pbc2) to true is like duplicating the first column (or row) of the matrix after its last column (or row).
set na to 4 -- 0, pi/2, pi, 3*pi/2
set nr to 5
set a to creatematrix "x" ncols na nrows nr range {0, 3 * pi / 2}
set r to creatematrix "y" ncols na nrows nr range {0, 2 * pi}
set {x, y, z} to {"r*cos(a)", "r*sin(a)", "sin(a+r)"}
set {x, y, z} to evalformula {x, y, z} with {a:a, r:r}
set {x, y, z} to ArrayToMatrix({x, y, z}, na, nr)
set sm to QuickScalarMap(x, y, z, 0) -- no periodic b.c.
--
set pbc1 of sm to true -- set periodic b.c.
draw sm's window
Graphic options for the scalar map
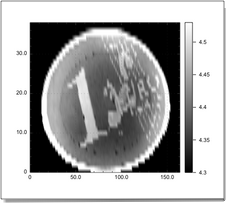
- inverted, draw palette and legend frame
- The following properties work like for the bitmap: inverted (inverts the palette), draw palette (hides/shows the color scale) and legend frame (moves the color scale).
-
resolution
- The scalar map is not a vectorial graphic. Before you save it as a document intended for printing you may want to up its resolution. By default the resolution property (in dots per inch) is set to 72, which is the proper resolution for screen display. If you require a high quality document, up the resolution property e.g. to 300 before saving the window as a pdf.
|