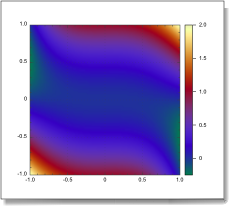
2nd example: QuickScalarMap
The quick way of displaying a scalar field on a 2d domain.
set s to "(x^3+y)*y"
set m to QuickScalarMap({-1, 1}, {-1, 1}, s, 0)
Import script
Here, instead of data, we supply a formula to describe the scalar field, and we supply ranges for x and y. In general, x and y would be lists of numbers, and the third argument would be a matrix with the corresponding numbers of rows and columns.
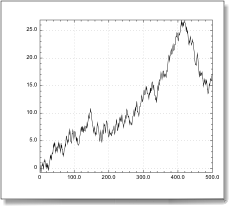
Graph of specified size
To create by script a graph with a given size, create explicitly the graphic window with the desired shape then pass its reference to QuickPlotLib's routines.
set w to make new graphic window with properties {pagewidth:6.25 as inches, pageheight:3 as inches}
set y to runningsum (randomarray 500 range {-1, 1})
set c to QuickCurve(0, y, w)
Import script
Finalizing a graph
The routines in QuickPlotLib make graphs with default settings. Once created you can bring any change to the graph by script, using the reference to the newly created object.
set y to runningsum (randomarray 500 range {-1, 1})
set c to QuickCurve(0, y, "Random walk")
set v to container of c -- the plot view
set xlabel of v to "t (seconds)"
set ylabel of v to "x (m)"
draw window of c
Import script
|
|