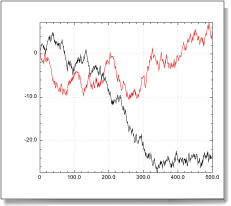
Using QuickPlotLib you can create another object in the same graph as a previous one. Just call again the same routine which created the object and provide a reference to its container, the graphic view which contains it, as the last argument. In the example below we make a curve, then we make a second curve in the same plot (the plot view object).
set y to runningsum (randomarray 500 range {-1, 1})
set c to QuickCurve(0, y, 0)
set v to container of c -- the plot view
set y3 to runningsum (randomarray 500 range {-1, 1})
set c2 to QuickCurve(0, y3, v)
Import script
QuickCurve automatically provides the new curve with a new color.
|
|
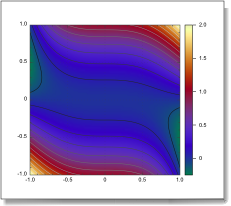
This works also with planar views. In the example below we make a color map (a scalar map object), then we draw a set of 15 contour lines (a contour map object) over the map - in the same plot (the planar view object).
set s to "(x^3+y)*y"
set m to QuickScalarMap({-1, 1}, {-1, 1}, s, 0)
set v to container of m -- the planar view
QuickContourMap({-1, 1}, {-1, 1}, s, 15, v)
Import script
|
|