
QuickBitMap
|
|
Previous | Next | |
|
|
||
|
QuickBitMap
|
||
| Home ▸ Documentation ▸ SmileLab ▸ Scripting ▸ Making graphs by script ▸ QuickPlotLib ▸ QuickBitMap | ||
|
|
||
QuickBitMap(z, anObject) displays a raster image of z. z had to be a matrix. In a raster image, the x and the y coordinates are simply the column and row indexes: you cannot change them.set {x, y, z} to QuickFormulaMatrix({-1, 1}, {-1, 1}, "tan( pi/4*x*y)") |
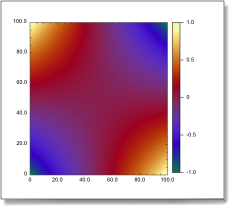 A bitmap image of a 2-d array |
|
|
||
| Copyright ©2008 Paris, Satimage | ||