Introduction
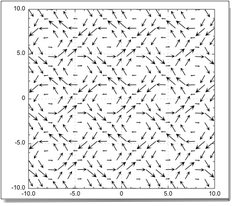
A vector plot displays a 2D vector field that is defined on a set of 2D points.
The field may be defined on an arbitrary (x(u,v),y(u,v)) lattice.
Providing the vector plot with data
- xdata, ydata, vxdata and vydata
- vxdata and vydata are the two components of the vector field, xdata and ydata are the coordinates of the points where to plot the vectors.
There are two modes for providing the vector plot with data:
- you can follow the same rules as for the scalar map: you must provide matrices for vxdata and vydata. This mode allows to handles the cases where the set of the (x,y) points is given as a 2-dimensional parametric family (x(u,v),y(u,v)).
- you can provide four lists (with the same size) as the xdata, ydata, vxdata and vydata. The plot will show one arrow for each (x,y) pair.
|
|
- vector scaling and use view scaling
- You control the size of the arrows with two properties vector scaling and use view scaling. When use view scaling is set to true (the default value) the scale used to draw the arrows follows the scales of the axes, considering a multiplicative factor vector scaling. If vector scaling is set to 1.0 (the default value), vx and vy use the same scales as x and y, i.e. the scales shown by the axes. A larger (smaller) vector scaling makes larger (smaller) arrows.
Setting use view scaling to true is required, e.g. to display velocity fields. Instead you can set use view scaling to false and provide the scale of the arrows, in pixels per user (vxdata and vydata) unit, as the vector scaling property. The arrows will have an absolute size and orientation, regardless of the settings of the axes and of the zoom.
Graphic options for the vector plot
-
pen color
- To have the arrows draw in a different color than black (the default setting) enter a rgba color as the pen color.
-
arrow style
- To suppress the point of the arrows and draw only strokes set the arrow style to 0. Setting arrow style to 2 draws only the stroke around the arrow head. Setting arrow style to 1 (the default setting) fills the arrow.
-
arrow def
- You can customize the shape of the point and its size with respect to the pole. The shape of the point is defined by providing as the arrow def property a list of real {smallLength, overallLength, overallWidth} which define the three dimensions of the point for an arrow with a total length (pole plus point) equal to unity.
|